blog
Domain Monitoring Run History for Deliverability Troubleshooting
Query domain monitoring run history by status and time window to diagnose regressions, compare remediation attempts, and confirm recovery.

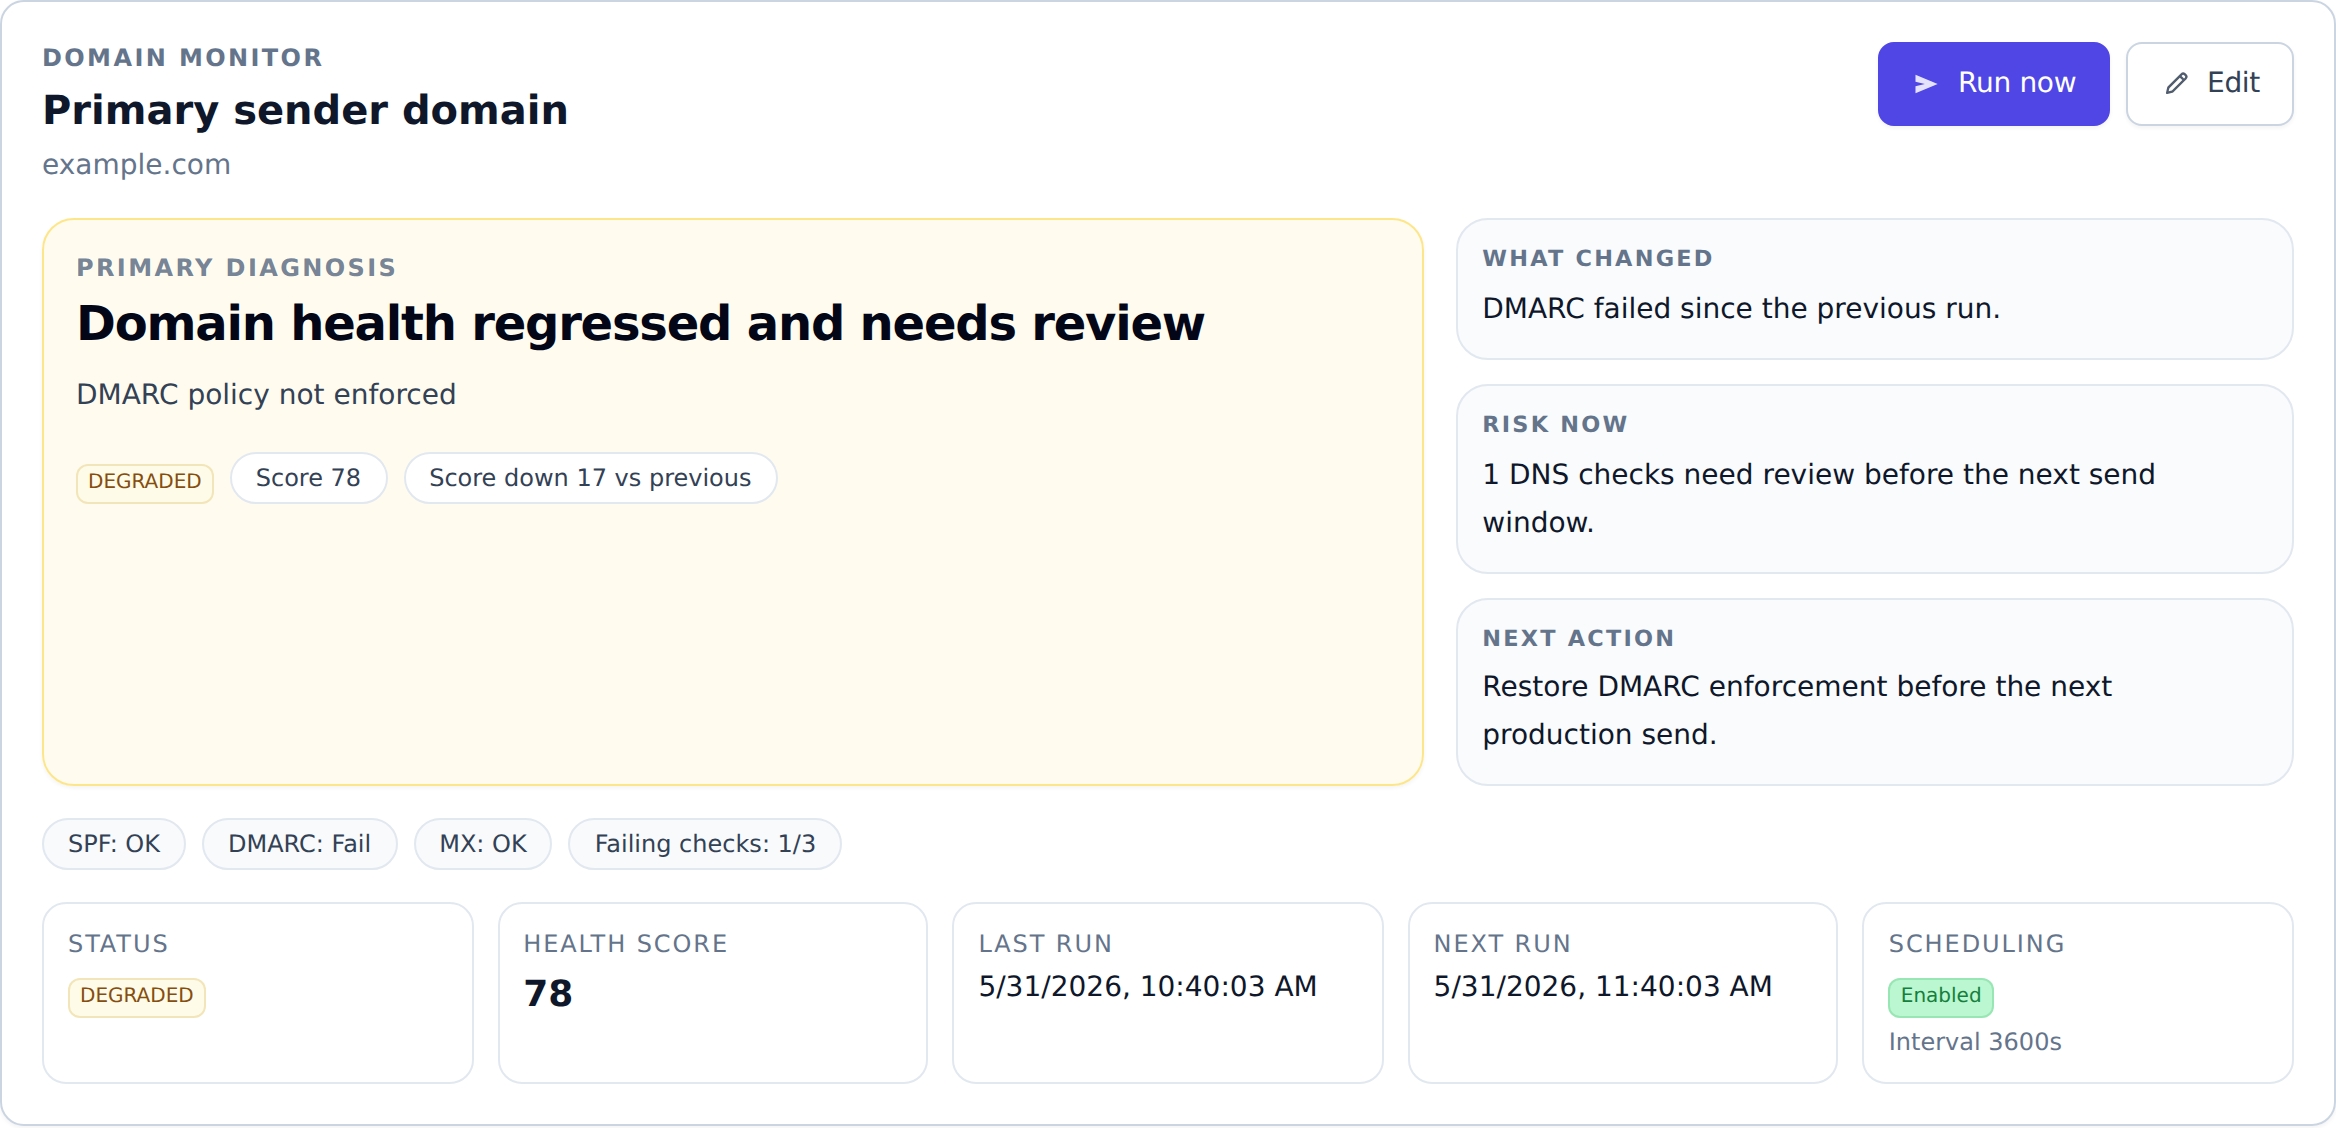
When domain health changes, context matters more than a single result. One run might look healthy, but a 48-hour trend can reveal repeated degradations after each deployment.
getDomainMonitorRuns gives you that context.
Why historical runs are so valuable
Run history helps answer critical incident questions:
- When did this problem begin?
- Is it intermittent or persistent?
- Did our last DNS change actually help?
- Are failures clustered around specific times?
That's the difference between guessing and diagnosing.
A practical way to use run history during an incident
When you get a deliverability alert, it's tempting to jump straight to "fix DNS". Run history helps you slow down for 30 seconds and avoid false moves.
Use this sequence:
- Pull the last 20 runs.
- Find the first failed run and its timestamp.
- Compare that time to known changes: DNS edits, sending provider changes, deploy windows.
- Trigger a run-now check after your remediation.
- Confirm that both the latest run is healthy and the next few scheduled runs stay healthy.
This prevents the classic mistake: one healthy rerun causes premature celebration, then the next scheduled check fails again.
Endpoint
GET /domain-monitor/monitors/{monitorId}/runs
Query parameters
sincebeforestatuslimit
cURL example
curl -sS "https://api.mailslurp.com/domain-monitor/monitors/$MONITOR_ID/runs?status=FAILED&limit=20" \
  -H "x-api-key: $API_KEY"
Tips for making the response useful in tooling
If you're building internal dashboards or runbooks, a few small choices make run history dramatically more actionable:
- show the "top finding" inline per run so operators can scan quickly
- link each run to the monitor detail view (configuration + current state)
- keep a quick filter for the last 24 hours (most incidents are recent)
- group intermittent failures by finding type (SPF, DMARC, MX) rather than by timestamp alone
The goal isn't just storing history. It's turning history into a timeline someone can understand in a minute.
Practical UI recommendations
- Default to latest-first ordering.
- Add one-click filters for
CRITICALandFAILED. - Show findings inline (or in expandable rows) so operators don't have to open each run.
Build a timeline
Strong monitoring isn't just detecting issues. It's preserving the timeline that explains why they happened.