blog
Domain Monitoring Time Series API for Health Trend Dashboards
Use time-series aggregates from domain monitoring to visualize health trends, healthy rates, and failure patterns across domains.

Raw run logs are essential, but dashboards need shape and direction: are things getting better, worse, or flat?
That's exactly what getDomainMonitorSeries provides: chart-ready aggregates by hour or day.
Why teams need series data
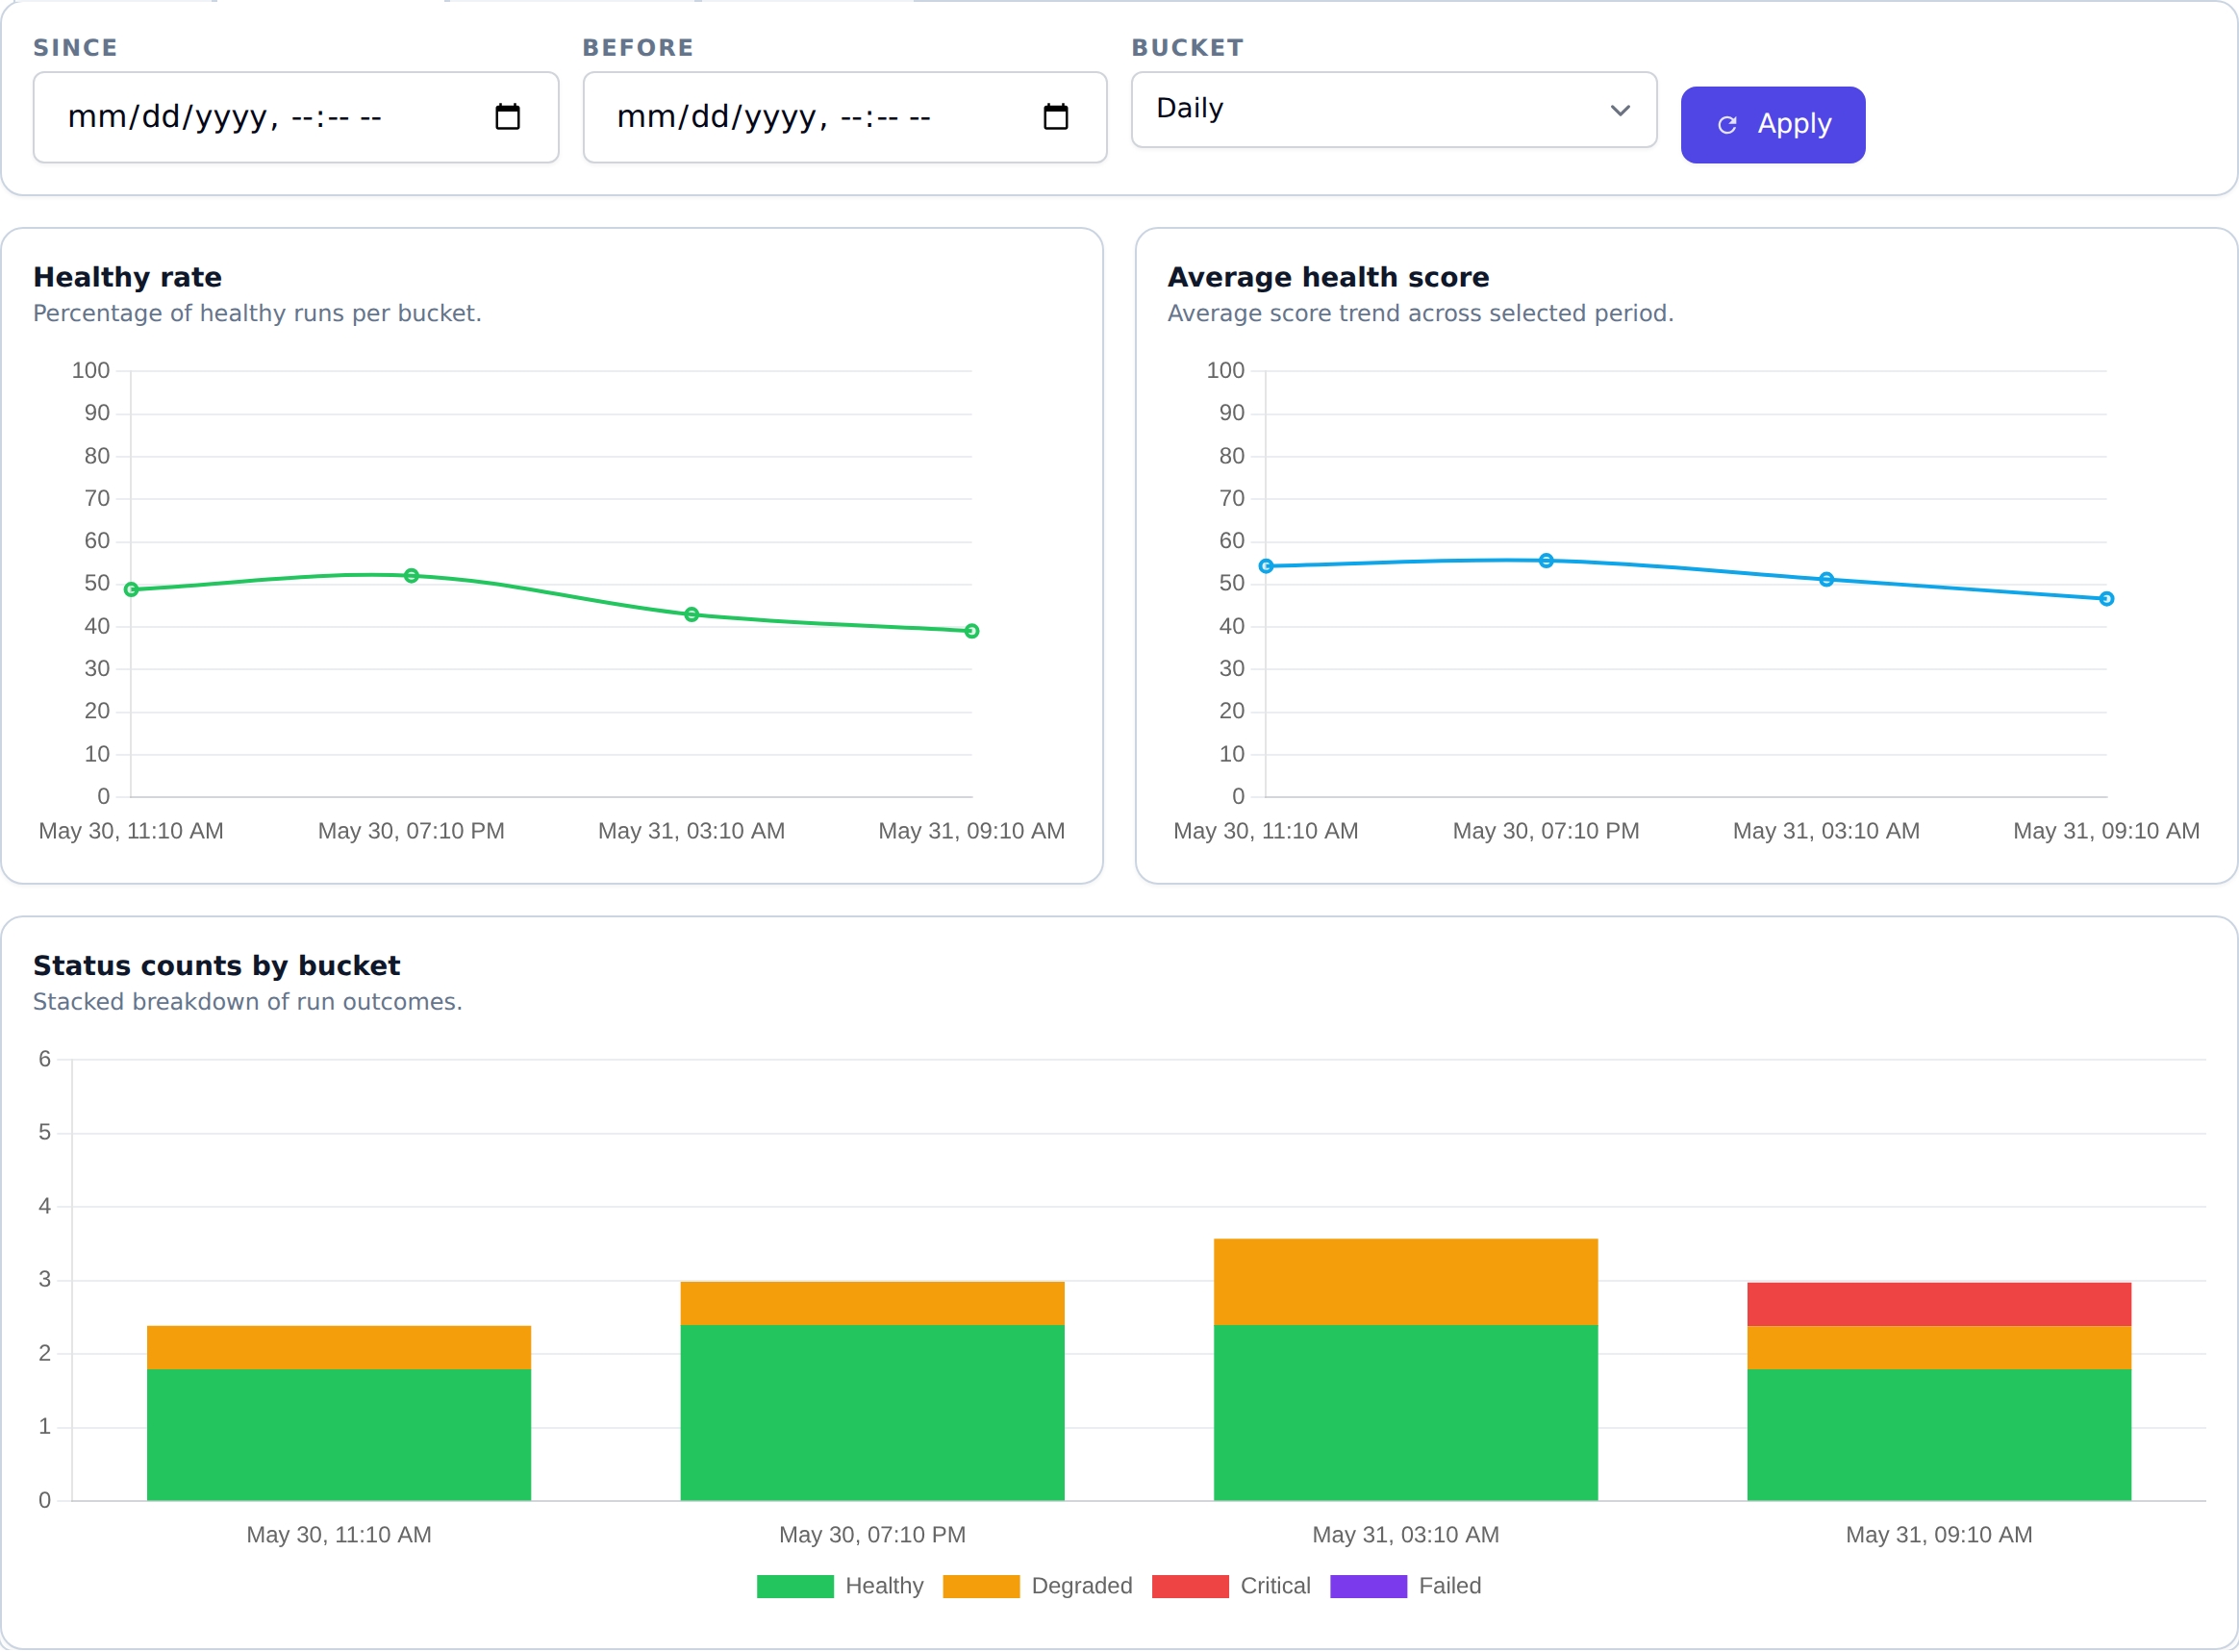
With series points, you can visualize:
- healthy-rate changes over time
- average health score movement
- status distribution by time bucket
This helps both technical and non-technical stakeholders understand risk quickly.
Endpoint
GET /domain-monitor/monitors/{monitorId}/series
Query parameters
sincebeforebucket(HOURorDAY)
cURL example
curl -sS "https://api.mailslurp.com/domain-monitor/monitors/$MONITOR_ID/series?bucket=DAY" \
  -H "x-api-key: $API_KEY"
What a good response looks like
Series responses are most useful when each bucket point contains just enough to drive charts:
- total runs
- count of healthy vs failing runs
- average score (or median) for the bucket
That lets you build trend charts without re-aggregating hundreds of runs in the browser or in a client service.
How to pick the right bucket size
Bucket size is a tradeoff between noise and visibility:
HOUR: best when you're debugging "something changed overnight" or you're running checks frequently.DAY: best for weekly reporting and broader posture reviews.
If you're unsure, start with DAY and only drop to HOUR during investigations.
Good chart patterns
- Line chart: average health score.
- Line chart: healthy rate.
- Stacked bars: run count by status.
Turn logs into trends
If your team wants monitoring that drives decisions, not just alerts, trend visualization is mandatory. This endpoint gives you the right data shape for that.