
blog
Email Deliverability Report API from Domain Monitoring Insights
Generate an email deliverability report from domain monitoring insights, including health scores, failure streaks, and prioritized remediation findings.

Most teams already have more deliverability data than they can discuss in one review. What they need is a report that answers three questions quickly:
- Is the sending domain stable?
- Is sender risk improving or getting worse?
- Which finding should have an owner today?
MailSlurp's getDomainMonitorInsights endpoint turns a period of domain-monitor runs into a compact operational summary. This guide shows how to request it, interpret the response, and combine it with message and inbox-placement evidence.
Quick answer
Call:
GET /domain-monitor/monitors/{monitorId}/insights
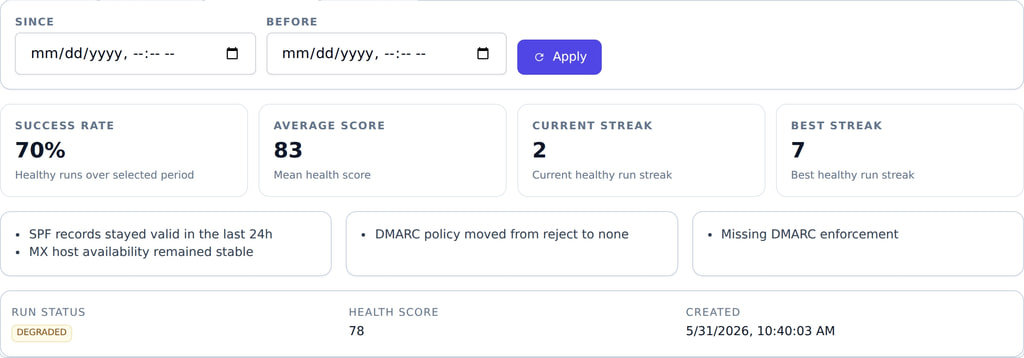
The response includes run counts by health state, success rate, average health score, healthy streaks, positive and attention signals, prioritized findings, and the latest run. Use optional since and before query parameters to keep weekly or monthly reports comparable.
This endpoint summarizes domain and sender-authentication posture. Pair it with inbox placement testing, spam checks, and received-message evidence when the report needs to cover the complete customer-visible outcome.
What an email deliverability report should do
"Deliverability report" can mean a few different things. Some reports focus on inbox placement testing. Others focus on authentication and domain posture. This endpoint is in the second category: it helps you summarize the domain health signals that typically cause deliverability to drift.
A useful deliverability report should:
- be readable by non-specialists (operators, product leads, marketing leads)
- highlight changes over time (not just current state)
- name the top 1 to 3 fixes that will reduce risk fastest
- separate urgent failures from background improvements
When you treat deliverability like an operational surface area, the report becomes part of your weekly cadence rather than an emergency artifact.
What makes this endpoint useful
It combines multiple runs into higher-signal indicators such as:
- success rate
- average health score
- healthy streak metrics
- positive and negative signals
- top findings to prioritize
That makes it ideal for weekly reviews, handoffs, and leadership updates.
Endpoint
GET /domain-monitor/monitors/{monitorId}/insights
Optional query parameters:
| Parameter | Format | Use |
|---|---|---|
since |
ISO 8601 date-time | Start of the reporting window |
before |
ISO 8601 date-time | End of the reporting window |
Use the same reporting window each week. A rolling seven-day report and a calendar-month report answer different questions, so label the window in the output.
cURL example
curl -sS "https://api.mailslurp.com/domain-monitor/monitors/$MONITOR_ID/insights" \
  -H "x-api-key: $API_KEY"
For a fixed weekly window:
curl -sS \
  "https://api.mailslurp.com/domain-monitor/monitors/$MONITOR_ID/insights?since=2026-08-17T00%3A00%3A00Z&before=2026-08-24T00%3A00%3A00Z" \
  -H "x-api-key: $API_KEY"
Response fields to use in the report
The API returns a DomainMonitorInsightsDto with fields such as:
{
  "monitorId": "0d8fbe9f-0000-4000-8000-000000000000",
  "since": "2026-08-17T00:00:00Z",
  "before": "2026-08-24T00:00:00Z",
  "totalRuns": 24,
  "healthyRuns": 21,
  "degradedRuns": 2,
  "criticalRuns": 0,
  "failedRuns": 1,
  "successRate": 95.83,
  "averageHealthScore": 91.4,
  "currentHealthyStreak": 7,
  "bestHealthyStreak": 12,
  "goodPerformanceSignals": ["Domain checks were healthy/degraded in 95.83% of sampled runs."],
  "attentionSignals": ["Failed runs detected: 1."],
  "topFindings": ["Review the failed run before the next sender change"]
}
The values above are illustrative. Use your monitor's normal history to decide what counts as healthy, degraded, or urgent.
| Field group | What it tells the reader | Useful action |
|---|---|---|
totalRuns and health counts |
How much evidence exists and how it was classified | Confirm the window has enough completed runs |
successRate and averageHealthScore |
Percentage of healthy or degraded runs and the average posture during the window | Compare with the previous equivalent period |
| healthy streaks | Whether stability is sustained or intermittent | Investigate recurring breaks, not only the latest state |
| signal arrays | What improved and what needs attention | Turn each material signal into an owner-ready note |
topFindings |
The highest-priority summarized issues | Put the first actionable finding near the top of the report |
latestRun |
The most recent underlying evidence | Link readers to the run when they need detail |
TypeScript example
This example fetches a fixed reporting window and turns the response into a compact summary object:
Run this code from a trusted server or CI environment. Keep the MailSlurp API key out of browser code and client-side bundles.
type DomainMonitorInsights = {
  monitorId: string;
  since: string;
  before: string;
  totalRuns: number;
  healthyRuns: number;
  degradedRuns: number;
  criticalRuns: number;
  failedRuns: number;
  successRate: number;
  averageHealthScore: number;
  currentHealthyStreak: number;
  bestHealthyStreak: number;
  goodPerformanceSignals: string[];
  attentionSignals: string[];
  topFindings: string[];
};

async function getWeeklyDeliverabilitySummary(
  monitorId: string,
  since: string,
  before: string,
) {
  const query = new URLSearchParams({ since, before });
  const response = await fetch(
    `https://api.mailslurp.com/domain-monitor/monitors/${monitorId}/insights?${query}`,
    {
      headers: { "x-api-key": process.env.MAILSLURP_API_KEY! },
    },
  );

  if (!response.ok) {
    throw new Error(`MailSlurp insights request failed: ${response.status}`);
  }

  const insights = (await response.json()) as DomainMonitorInsights;

  return {
    window: `${insights.since} to ${insights.before}`,
    runs: insights.totalRuns,
    successRate: insights.successRate,
    averageHealthScore: insights.averageHealthScore,
    healthyStreak: insights.currentHealthyStreak,
    needsAttention: insights.attentionSignals,
    topActions: insights.topFindings,
  };
}
Keep the full API response with the report even if the reader only sees the summary. The underlying run counts and signals make follow-up questions easier to answer.
How to turn insights into a report people act on
If you already have dashboards, the main win is packaging. A good report tends to follow a consistent structure:
- Current risk summary (one sentence)
- Trend summary (what changed since last week)
- Top findings (prioritized)
- Recommended actions (what to do next)
- Evidence links (run history, raw DNS checks, tickets)
The point is to remove interpretation work. Your audience should be able to answer "what should we fix first?" without opening five tools.
Combine the report with placement and message proof
Domain posture is one layer of deliverability. A complete operational report should distinguish it from two other layers:
- Message proof: Did the real signup, reset, billing, or campaign path produce the correct email on time?
- Inbox placement: Did the final message reach the expected folder across the providers customers use?
- Sender posture: Did SPF, DKIM, DMARC, MX, routing, or domain health change during the reporting window?
Use controlled MailSlurp inboxes for message proof, the inbox placement test for provider outcomes, and domain monitor insights for sender posture. When all three appear in one report, a reader can see whether a warning is a configuration problem, a message problem, or a provider-placement problem.
Example report outline (weekly)
Use this as a template for a weekly deliverability report meeting:
- Overall status: Healthy, Degraded, or Critical
- Auth posture: SPF status, DMARC policy strength, MX stability
- Trend highlights: improving, stable, deteriorating
- Top findings:
- finding 1 (impact + suggested fix)
- finding 2 (impact + suggested fix)
- finding 3 (impact + suggested fix)
- Action plan:
- owner, due date, and verification step (run-now or next scheduled run)
If you keep the outline consistent, stakeholders learn to read it quickly and the report becomes a reliable decision input.
Turn findings into owner-ready actions
Avoid copying a signal into the report without explaining what happens next. Convert each material finding into this shape:
Finding: DKIM posture changed after the provider migration.
Customer risk: Password reset and signup email may lose trusted alignment.
Owner: Messaging platform team.
Next check: Compare current DNS with received Authentication-Results headers.
Recovery proof: Rerun the reset workflow and save the passing message and placement result.
This is where the report becomes operational. A useful finding has a customer risk, an owner, a next check, and a clear condition for closure.
Common reporting mistakes
Reporting only the latest state
One healthy run can hide an unstable week. Include run counts and streaks so intermittent failures remain visible.
Treating the health score as the whole diagnosis
Use the score as a directional summary. The signal arrays, top findings, latest run, and received-message evidence explain what the team should investigate.
Mixing sender posture with inbox placement
A domain can have valid authentication while a provider places a message in spam. Report the layers separately, then connect them when the evidence supports the same cause.
Publishing actions without owners
"Review DMARC" is not an action plan. Name the domain, owner, next check, and recovery test.
Changing the reporting window
A five-day period and a fourteen-day period are difficult to compare. Use fixed since and before boundaries for recurring reports.
Where this fits in UI
- Summary cards above trend charts.
- "Needs attention" callouts for operators.
- Executive-friendly snapshot blocks for status meetings.
Make it actionable
If run history is the evidence, insights are the narrative. This endpoint helps teams understand and communicate domain health without rebuilding the same summary every week.
Connect the report to the workflow that matters: attach a received message, a placement result, and the sender-health finding that needs attention. Then keep the successful rerun that proves the fix worked.
FAQ
Does the insights endpoint test inbox placement?
It summarizes domain-monitor history and sender-posture signals. Use MailSlurp inbox placement testing separately, then include the placement result in the same operational report.
Should I use success rate or average health score?
Use both as trend indicators. Success rate is the percentage of monitor runs classified as healthy or degraded, while average health score summarizes the posture across the window. The underlying signals and findings provide the actionable detail.
How often should I generate the report?
Use a weekly report for active sending domains and after material DNS, provider, or sender changes. Add a monthly view for longer trends and recurring ownership reviews.
Can I automate the report?
Yes. Request a fixed time window, transform the response into your standard summary, and send the output to the review or incident workflow your team already uses. Keep links to the underlying MailSlurp evidence.
Start with MailSlurp domain monitoring or create a free account to build the first report from real monitor history.